Bitcoins per gold ounce weekly close YTD
/With the dramatic movements of both gold and Bitcoin this year, I wondered how they would look directly in terms of one another. Not finding just what I was looking for online, I built a simple spreadsheet to chart the cost of an ounce of gold in terms of Bitcoin.
For the sake of simplification, I artificially assumed that the US dollar functioned as a neutral intermediary between the two during this timeframe. Because I pieced together existing data from two sources and then combined them, I also simplified by using just a simple weekly close for each. The Bitcoin data comes from Bitcoincharts.com and the gold data from Investing.com. This is what emerged:
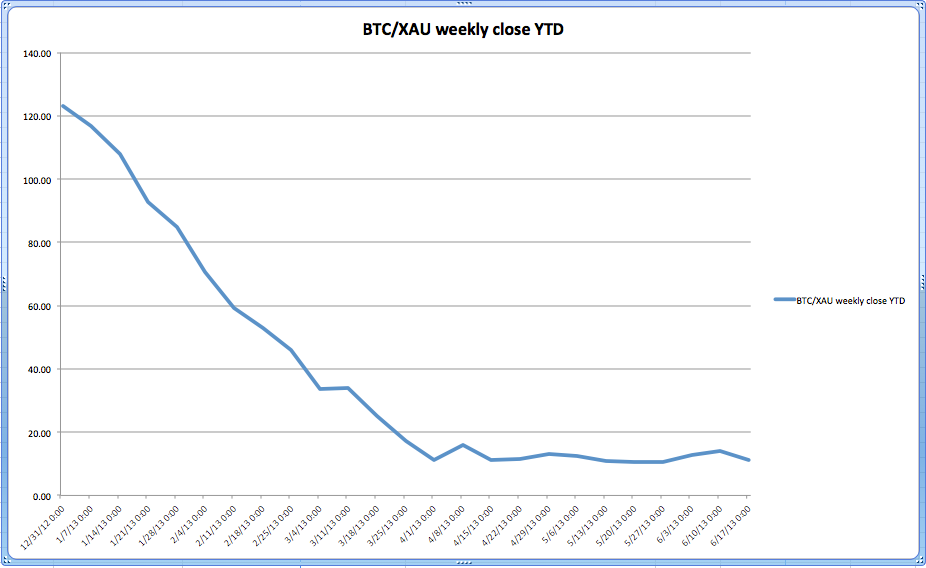
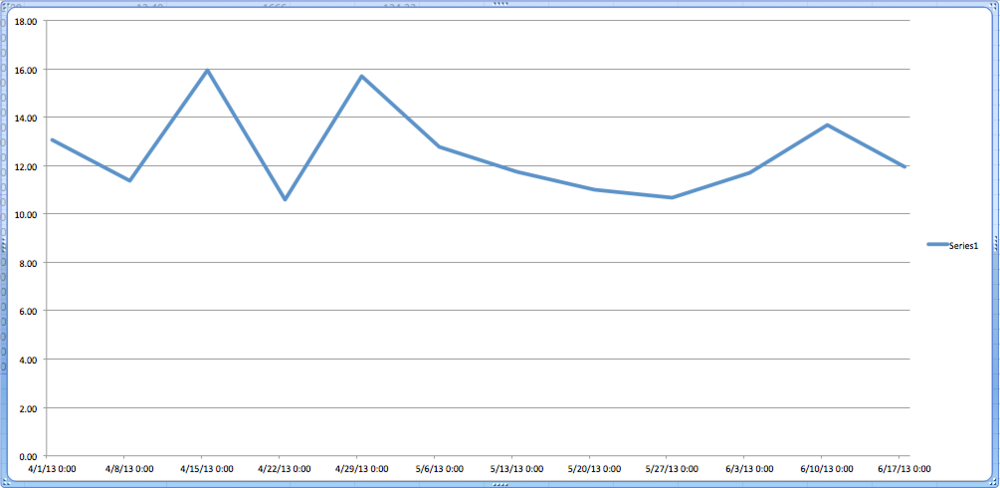
The number of Bitcoins per gold ounce fell rapidly and steadily for 14 weeks from over 120 Bitcoins per ounce at the start of the year, hit hard ground at the beginning of April at 13 Bitcoins per ounce, and then trended at an average weekly close of 13 Bitcoins per ounce (with 10.6–16.0 extremes) in the 12 weeks since then. It might be interesting to try put together a similar chart with more detailed data than a simple weekly close. As usual, the past cannot predict the future, but from the standpoint of economic history, this seems like an interesting sequence of events.
Here is a closeup of just since April 1: